
Assets' Real Understanding.
Make Asset Smarter.
Know Your Asset.
Asset Intelligence Reimagined.
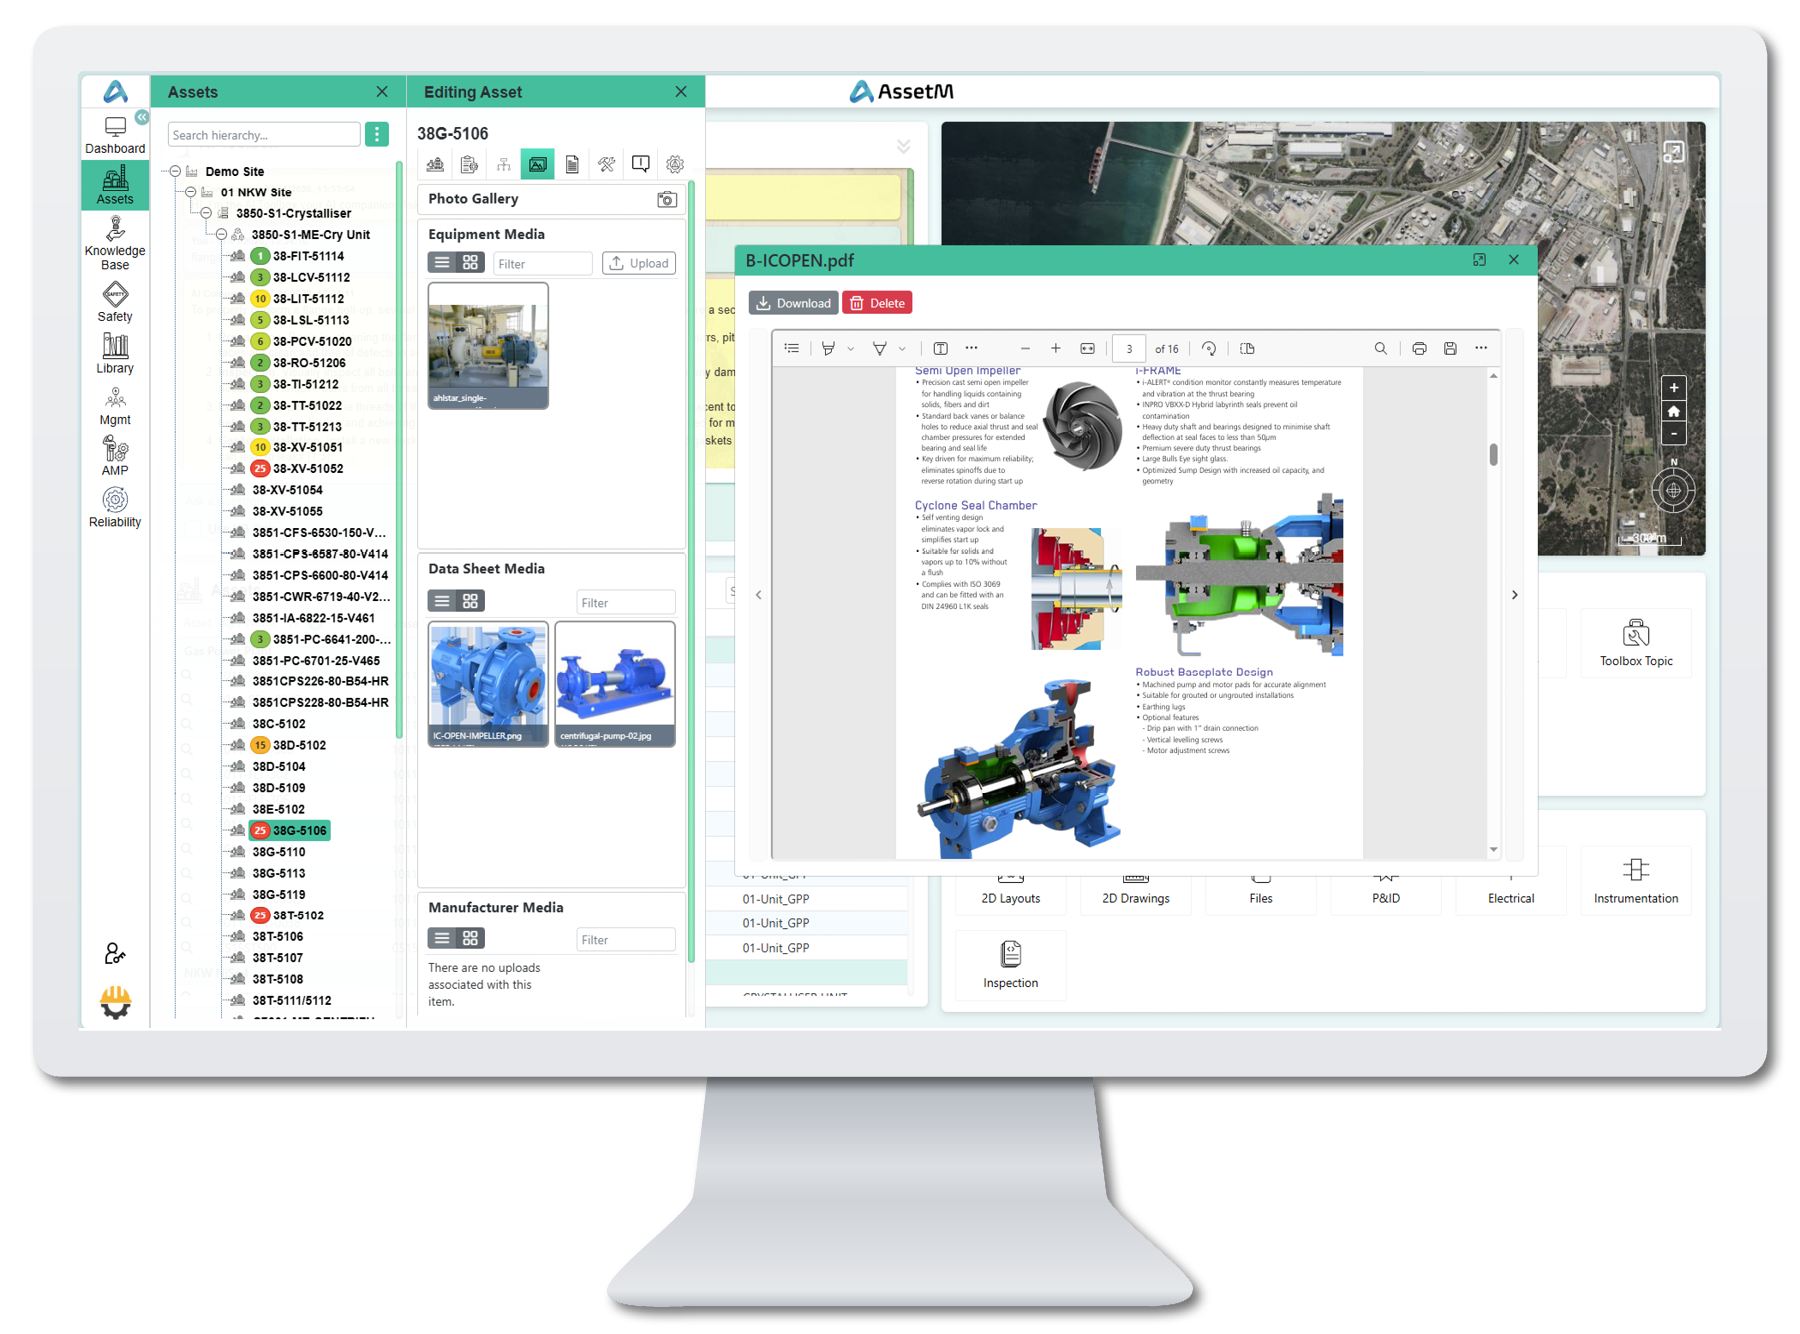
AssetM empowers organisations to build an intelligent, spatially aware asset hierarchy that mirrors real-world operations. From enterprise sites, systems to individual components, every asset is mapped within a parent - child framework, enabling visibility, precision, and control across the full lifecycle.
By integrating model-based systems engineering with spatial intelligence, AssetM transforms asset management into a dynamic, context-rich ecosystem. Each asset is enriched with detailed metadata - type, model, serial number, installation date, warranty, and maintenance history, providing real-time health insights through metrics such as uptime, MTBF, and root cause analysis.
This unified approach centralises intelligence for data-driven decision-making, compliance assurance, and predictive maintenance. From acquisition to retirement, AssetM delivers a seamless lifecycle perspective that accelerates planning, minimises downtime, and maximises ROI empowering sustainable growth and operational resilience in precision-driven industries.
Manual processes, Siloed Data, and Outdated Technology all have the potential to hold back Asset Performance, Safety and Compliances.


Asset Management is heartbeat of Performance, ROI, Safety, Reliability, and Public trust.
Challenges in Asset Management

Messy Data:
Inconsistent, inaccurate, or unstandardised data that undermines trust and analysis.
Inconsistent, inaccurate, or unstandardised data that undermines trust and analysis.

Disconnected Systems:
Platforms and software that don't communicate, creating information gaps and inefficiencies.
Platforms and software that don't communicate, creating information gaps and inefficiencies.

Handovers That Fall Apart:
Critical information is lost or delayed during transitions between EPC to Owner Operation.
Critical information is lost or delayed during transitions between EPC to Owner Operation.

Reactive Everything:
A culture of responding to issues only after they occur, leading to firefighting and higher costs.
A culture of responding to issues only after they occur, leading to firefighting and higher costs.

Teams Stuck in Silos:
Departments or groups work in isolation, hoarding information and hindering collaboration.
Departments or groups work in isolation, hoarding information and hindering collaboration.
Seeing the Unseen.
Radical Transparency.
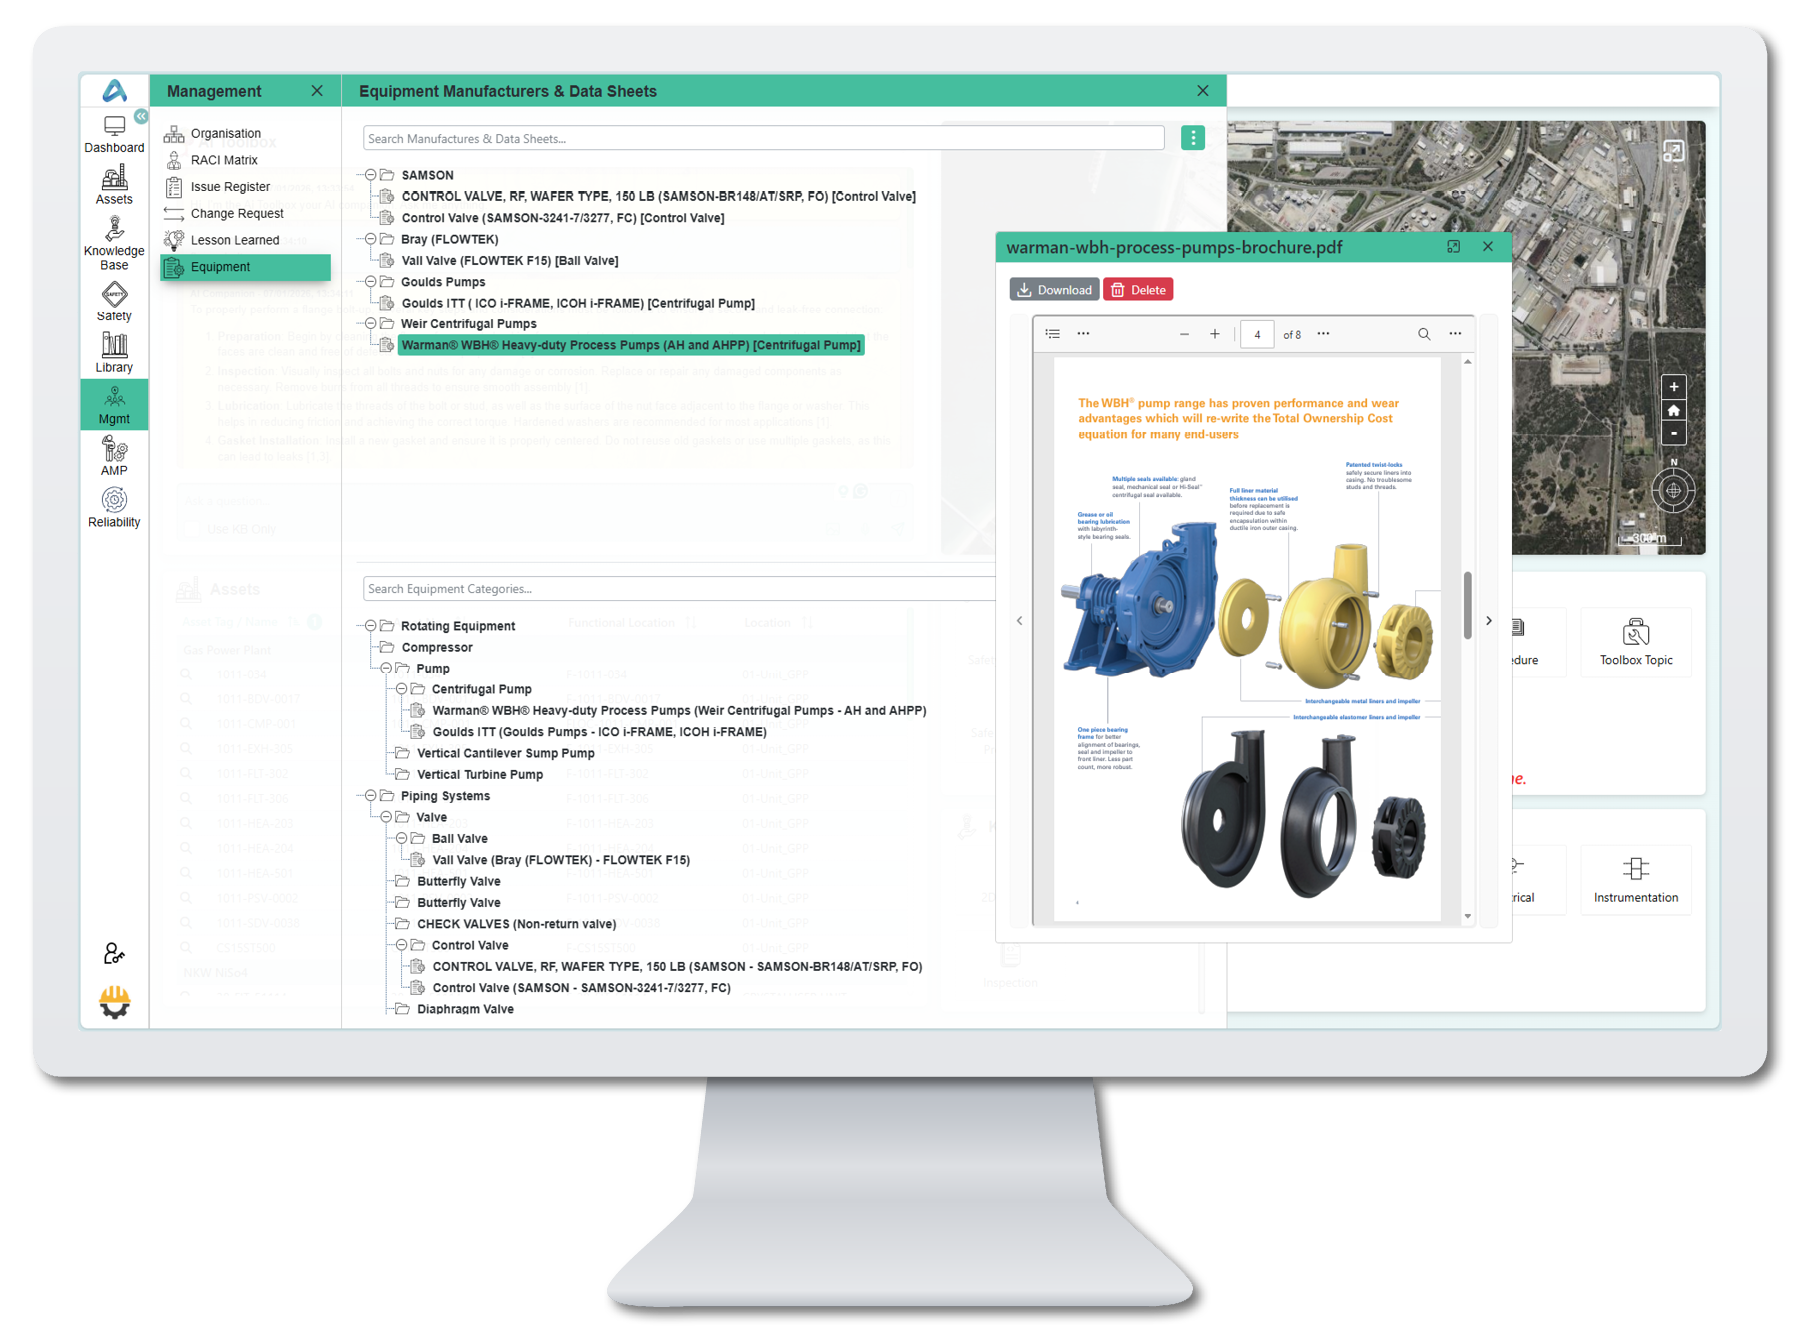
AssetM empowers organisations to monitor, analyse, and optimise asset performance across the full lifecycle, from acquisition to retirement.
By uniting asset monitoring, predictive maintenance, and intelligent analytics, it maximises equipment effectiveness and operational resilience. A structured digital hierarchy maps each site, asset, and component, enabling targeted prioritisation and proactive decision-making.
With automated workflows and centralised documentation, AssetM reduces maintenance costs by up to 30%, streamlines compliance, and extends asset lifespan. The result: reduced downtime, optimised resources, and sustainable growth—delivering a decisive competitive edge in industries where reliability, precision, and efficiency define long-term success.
Asset Criticality & Reliability.
Smart Maintenance Decisions.
Friction less Access to Complex Data.
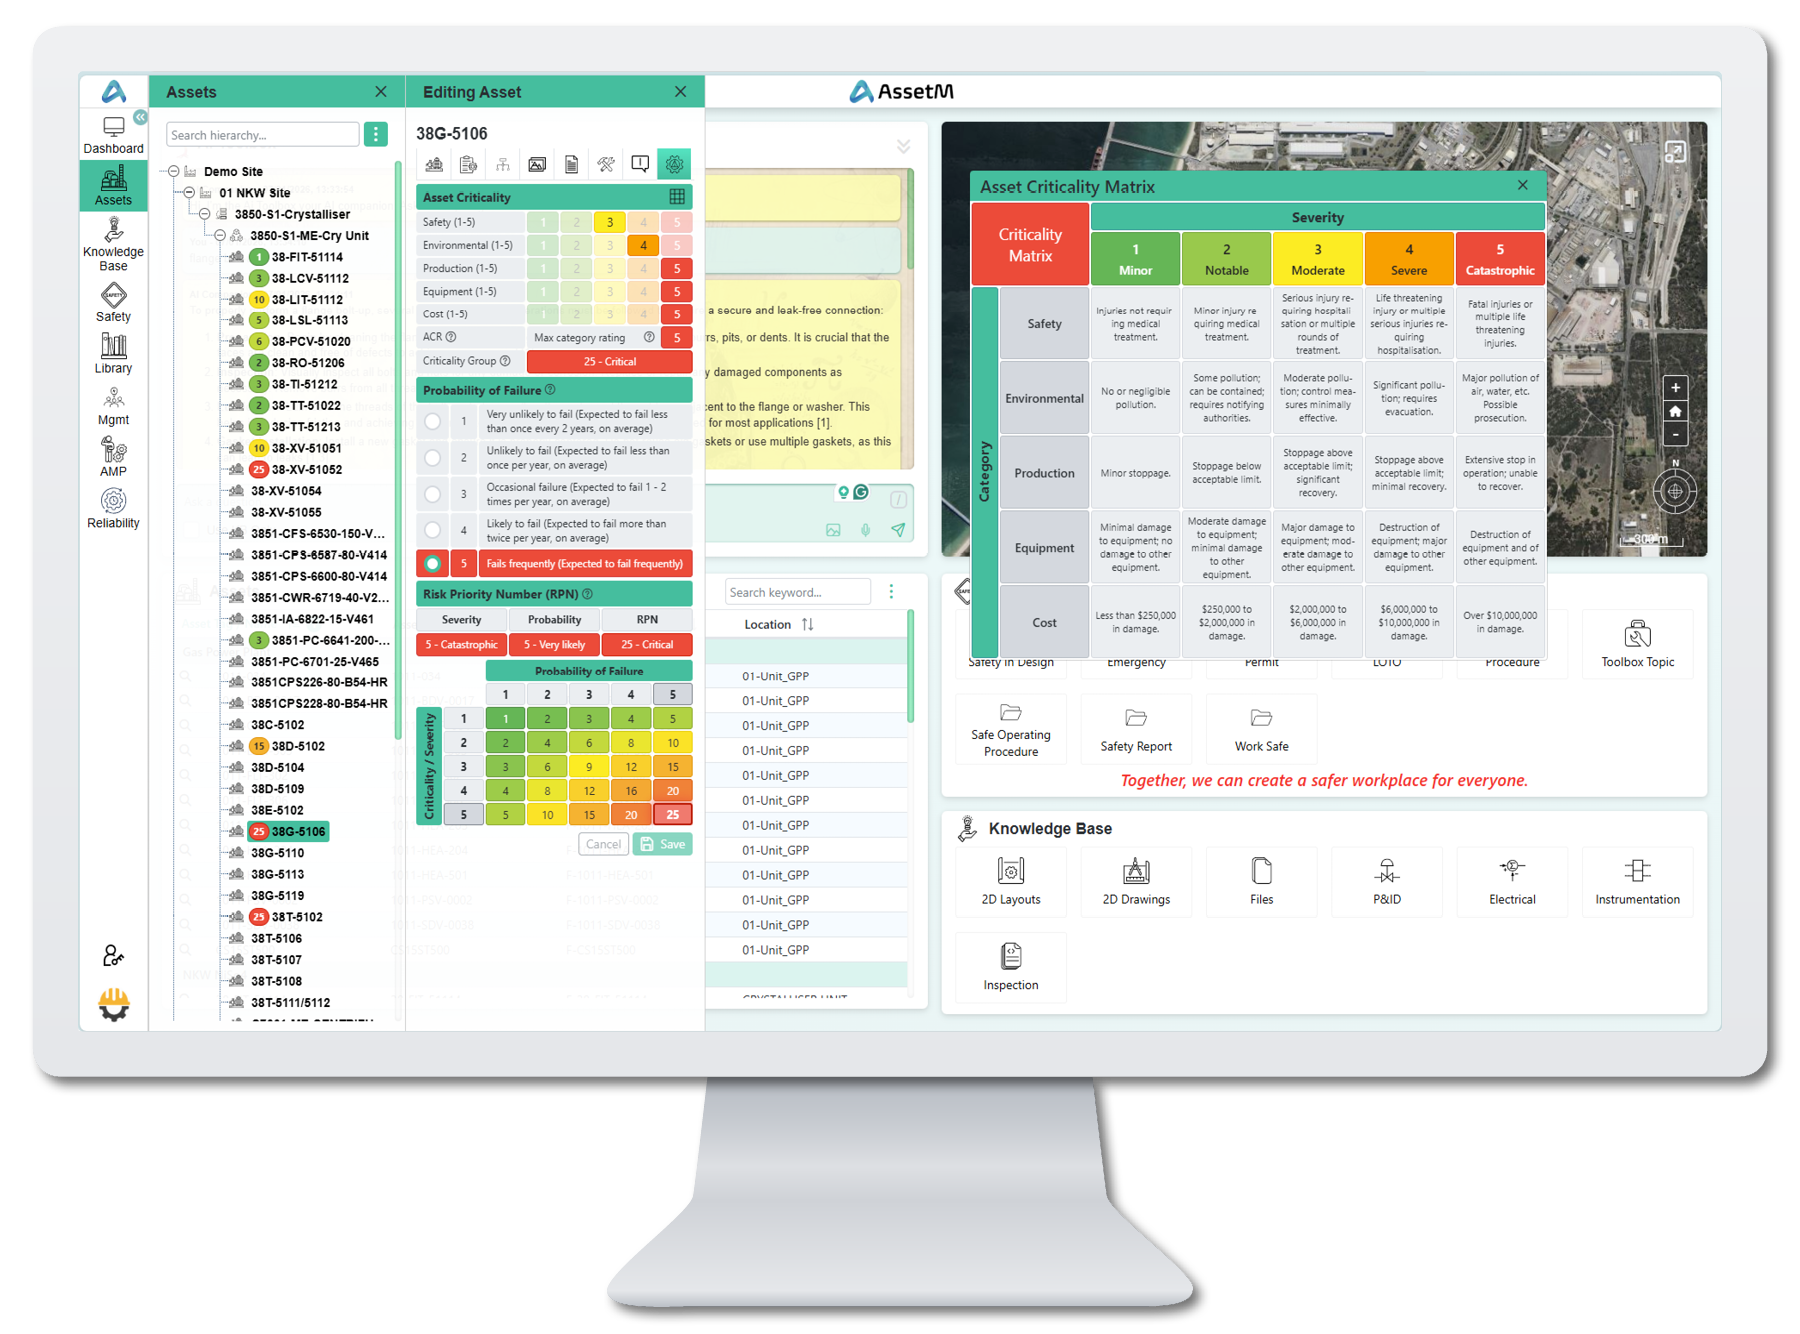
In a resource-constrained world, smart asset prioritisation is essential for operational excellence and risk mitigation. AssetM's Asset Criticality Analysis (ACA) is the premier solution, delivering powerful visual and analytical tools to evaluate, rank, maintain, and optimise your entire asset portfolio.
ACA assesses each asset's impact on production output, health & safety, and regulatory compliance, enabling precise criticality ranking and intelligent resource allocation. This targeted approach minimises unplanned downtime, maximises ROI, and strengthens overall resilience.
Guided step-by-step with real-time query support, AssetM makes criticality analysis intuitive and actionable. Position your organisation at the forefront of intelligent asset management with AssetM's transformative ACA solution.
Asset Reliability.
Smart Maintenance Decisions.
Friction less Access to Complex Data.


Weibull

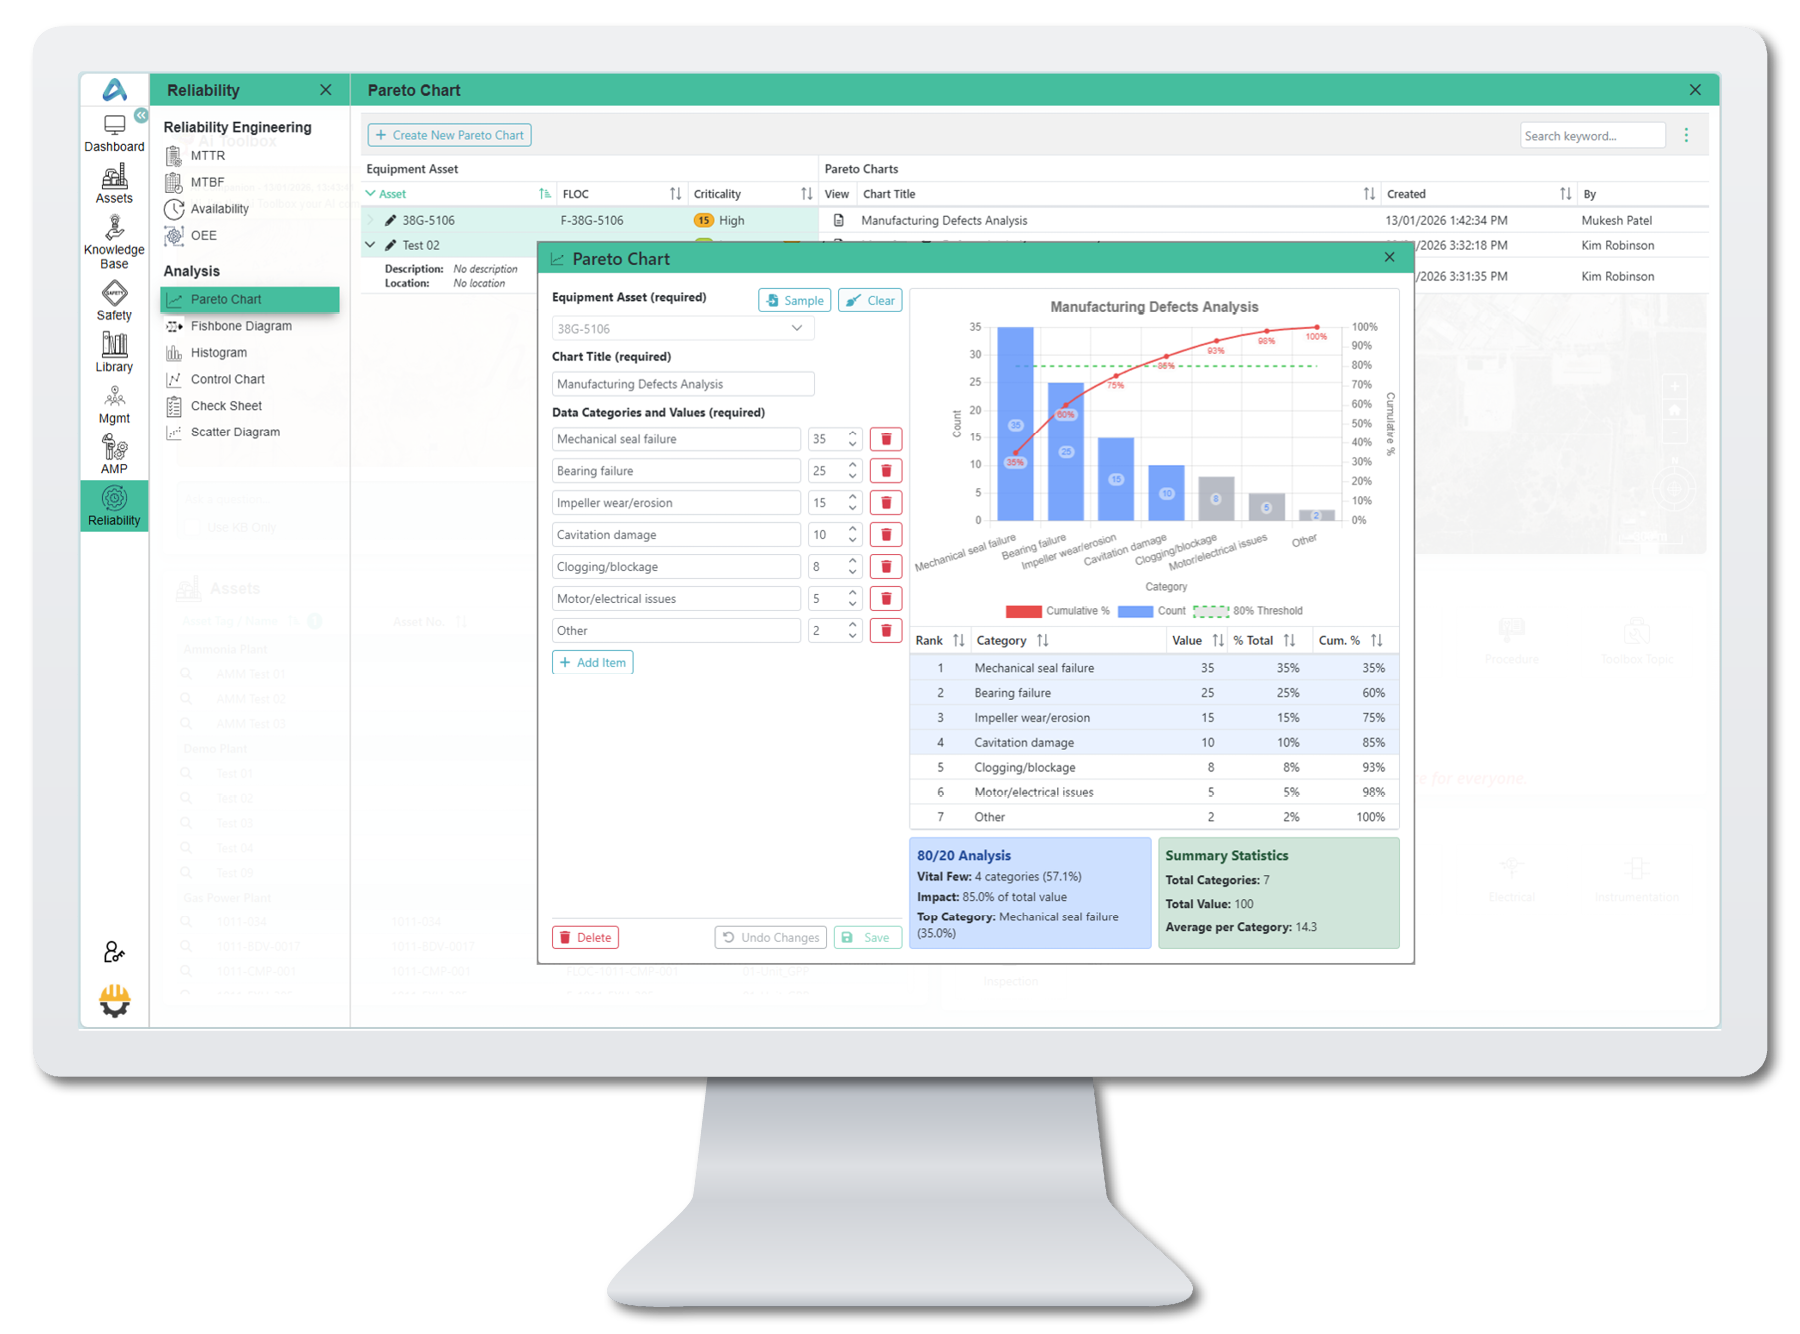
Imagine standing at the helm of a complex industrial ecosystem pumps, turbines, and conveyors driving production with precision. Over time, each failure tells a story: wear, design limits, or hidden stress factors. AssetM's Weibull Analysis transforms this story into foresight, turning raw failure data into predictive intelligence for smarter, data-driven maintenance.
More than a statistical model, Weibull reveals why and when assets fail. Its key parameters; the shape and scale factors, uncover whether breakdowns arise from early-life defects, random events, or predictable wear-out. This precision empowers engineers to shift from reactive repairs to proactive reliability strategies, forecasting spare-part needs, optimising maintenance intervals, and controlling lifecycle costs.
With AssetM, Weibull analysis evolves from a reliability tool into a strategic asset, minimising downtime, maximising longevity, and turning every data point into an advantage.
Reliability

OFFICE
300 Murray Street, Level 2 East,
The Wentworth Building,
Perth WA 6000
Australia